HAR (HTTP Archive format) is a log of a web browser's interaction with a site. This information is required for troubleshooting an issue between the LiveVox platform and the web browser that you use. At LiveVox, these are referred to as F12 logs or network and console logs.
Note
When capturing these logs, they must be collected from the computer that is experiencing the problem.
HAR logs are captured or recorded within the web browser. The primary goal of capturing the logs is to replicate the errant behavior that you are experiencing. Because of this, it's imperative to begin capturing or recording the logs before you attempt to replicate the problem. Begin capturing first; then try to replicate the problem, so that the problem is recorded.
Capturing Logs in Your Preferred Web Browser
HAR logs are captured differently depending on which web browser that you are using. We've provided instructions for some of the most commonly used web browsers:
Google Chrome and Microsoft Edge
Network Logs
-
Open a new window in your web browser and press the F12 key on your keyboard to open the Developer Tools pane, then click on the Network tab. Make sure to click Record so that activity is being captured:

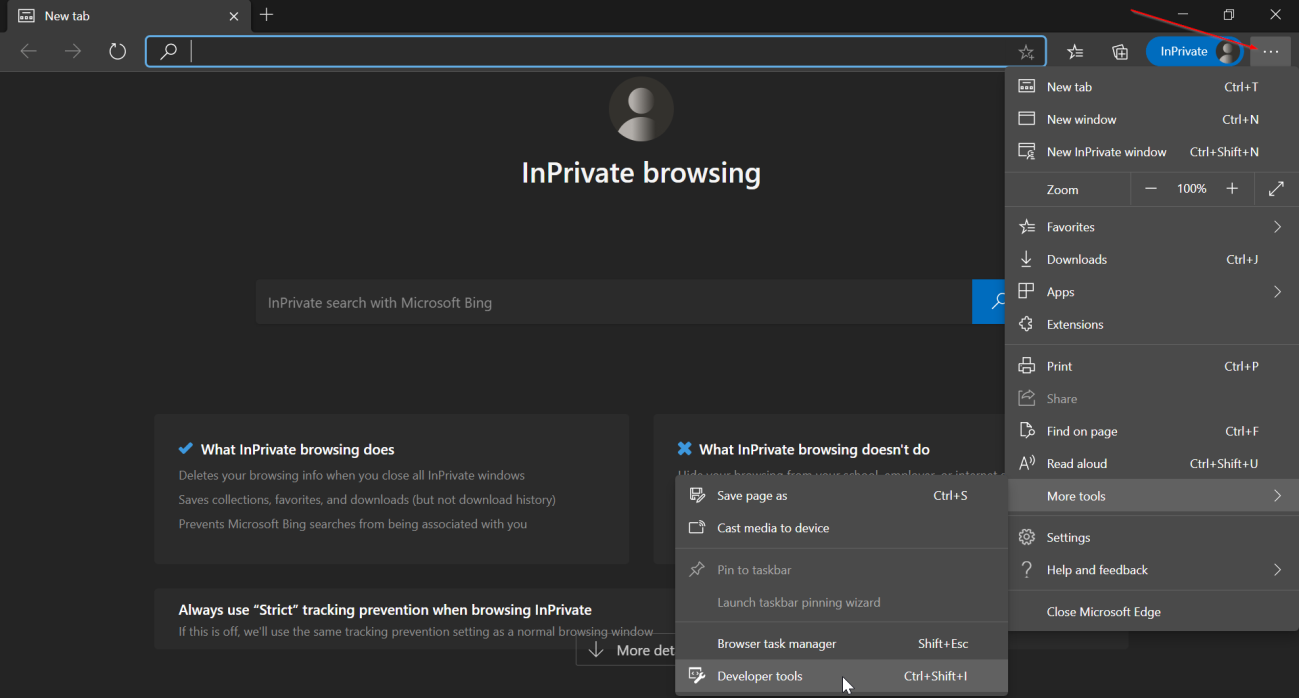
If your keyboard does not have Function keys, you can also click on the Settings icon in your browser, More Tools > Developer Tools. - Attempt to replicate the problem. Perform the action that is causing the issue that you are experiencing.
-
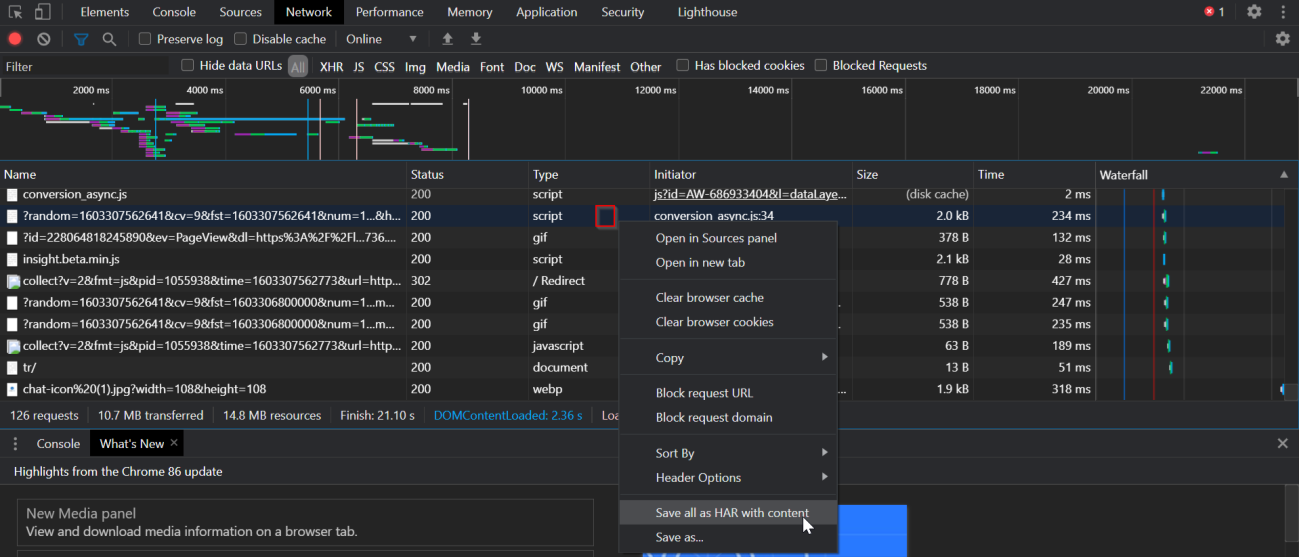
Once you experience the problem, proceed to Save all as HAR Content from the dropdown menu. In order to access this menu, right click on any row or blank space, then select Save all as HAR Content:
-
Save the HAR file to your preferred location on your computer. These can then be sent to the LiveVox Customer Care team via email as an attachment.
Console Logs
-
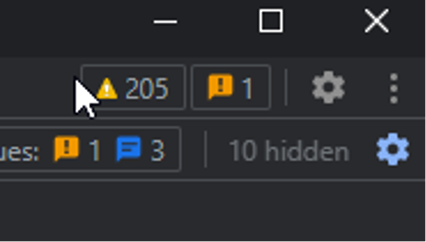
Before gathering Console Logs, we need to enable Timestamps. Navigate to the Gear icon in Developer Tools and click Preferences:
-
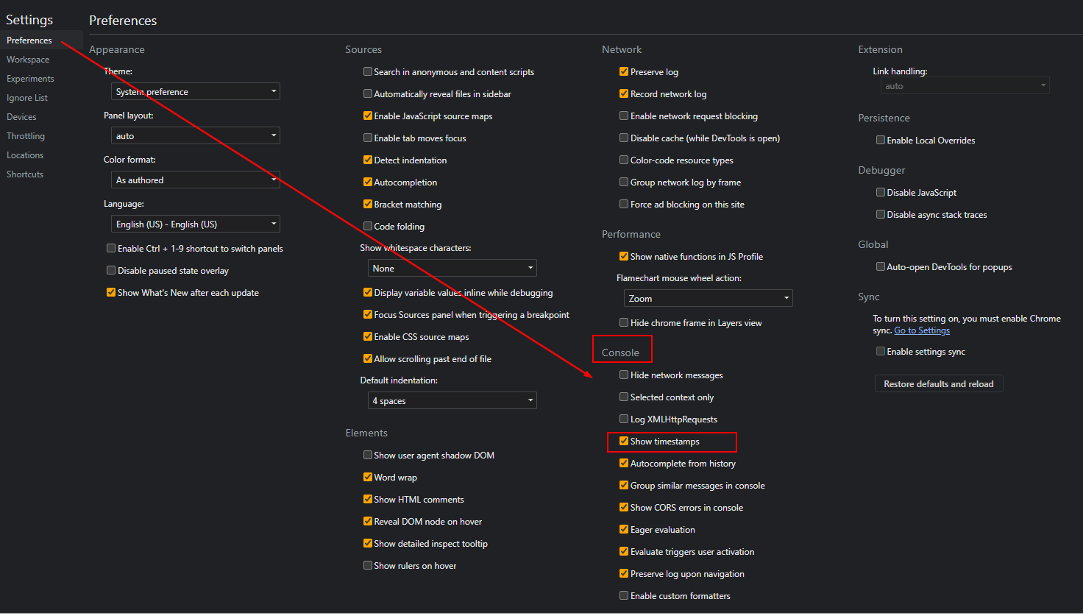
From Preferences, select the Show Timestamps option and return to the main Developer Tools page:
- Click on the Console tab within the same Developer Tools menu.
-
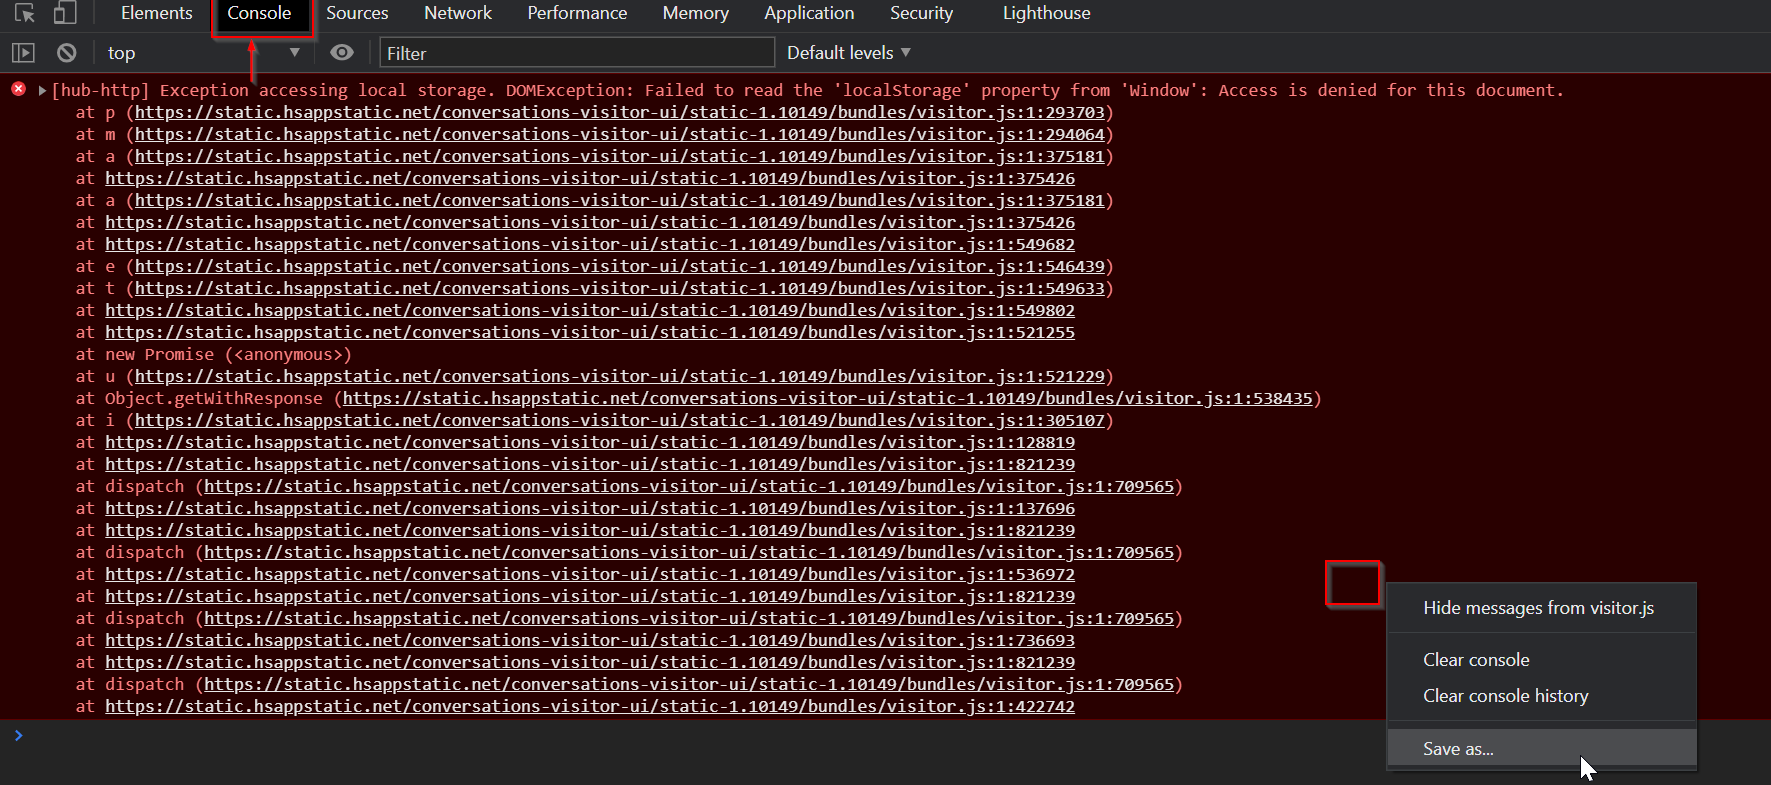
Attempt to replicate the problem as you did with the Network logs. Once the issue is experienced, right click on the logs and click Save As.
-
Save the logs as a .txt file in your preferred location on your computer. This can also be attached to your email to the LiveVox Customer Care team (along with the Console logs).
Locating Settings in Google Chrome or Microsoft Edge
-
Navigate to the three dots icon in the upper-right hand corner of your browser. It will be available under More Tools > Developer Tools:
Opera
Network Logs
-
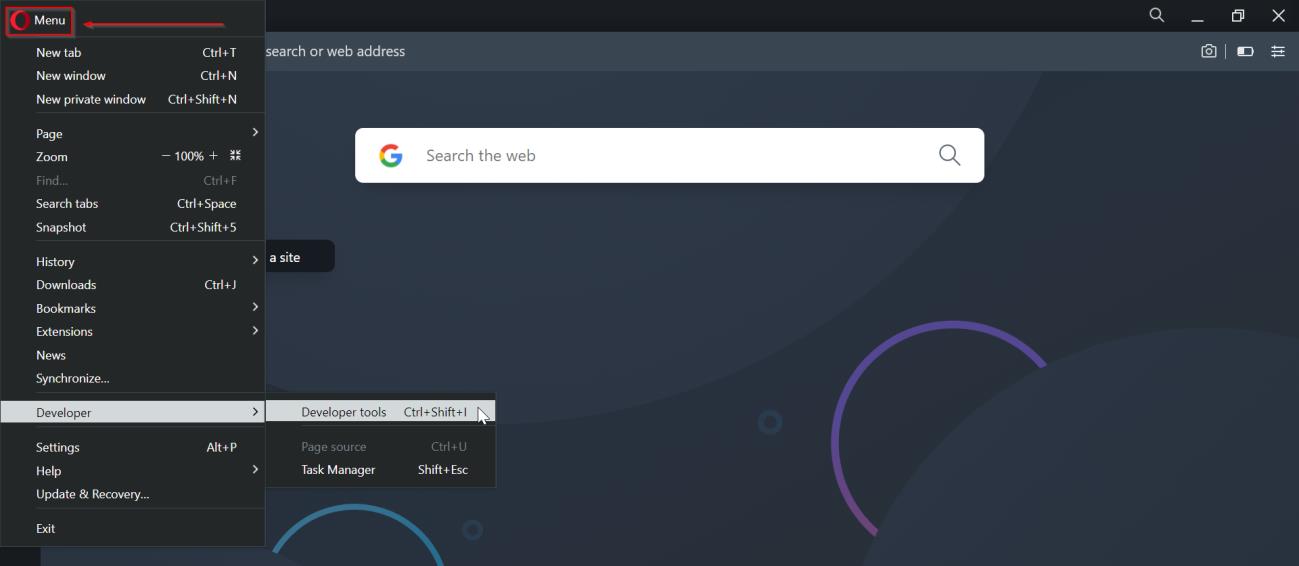
Navigate to the red "O" icon in the upper-left hand corner of the web browser. Select Developer > Developer Tools or (if using Windows) press Ctrl + Shift + I.
- Attempt to replicate the problem. Perform the action that is causing the issue you are experiencing.
-
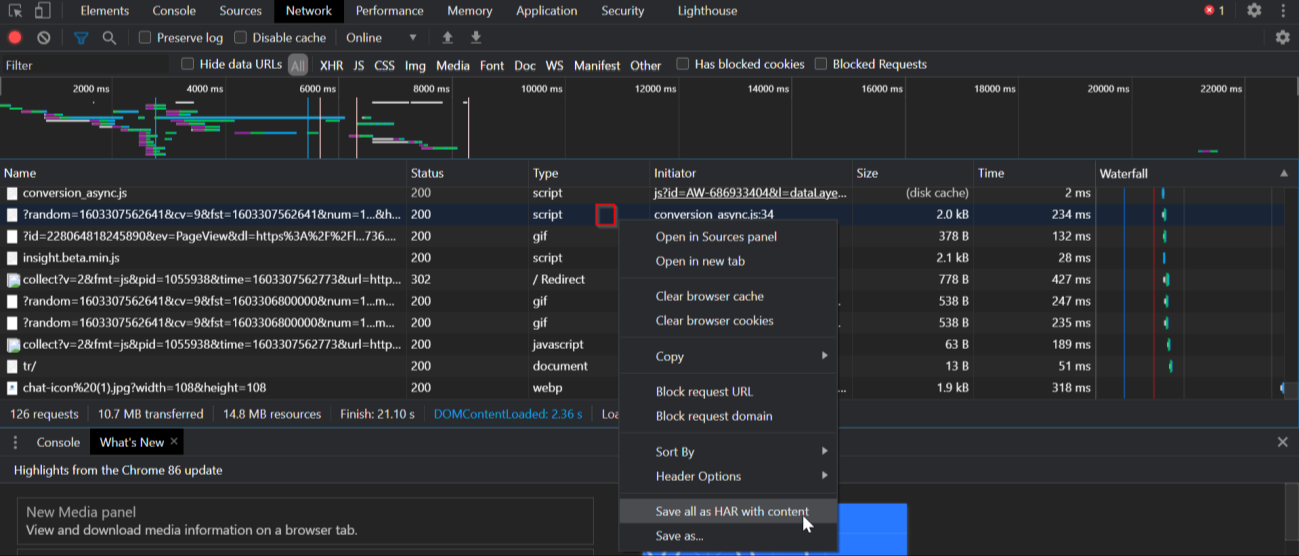
After replicating, Save the logs as an .HAR file. In order to save the log, right click on any row or blank space and select Save as HAR with content from the dropdown menu.
-
Save the HAR file to your preferred location on your computer. This file can be sent to the LiveVox Customer Care team via email as an attachment.
Console Logs
-
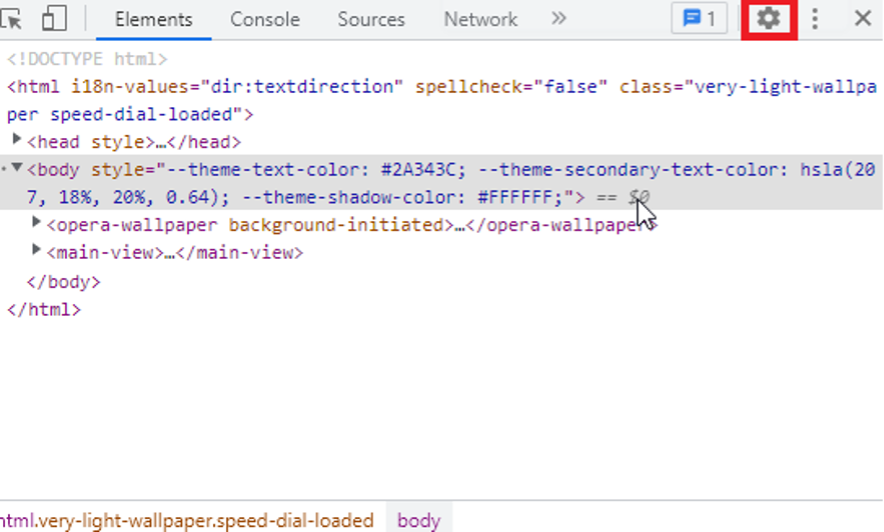
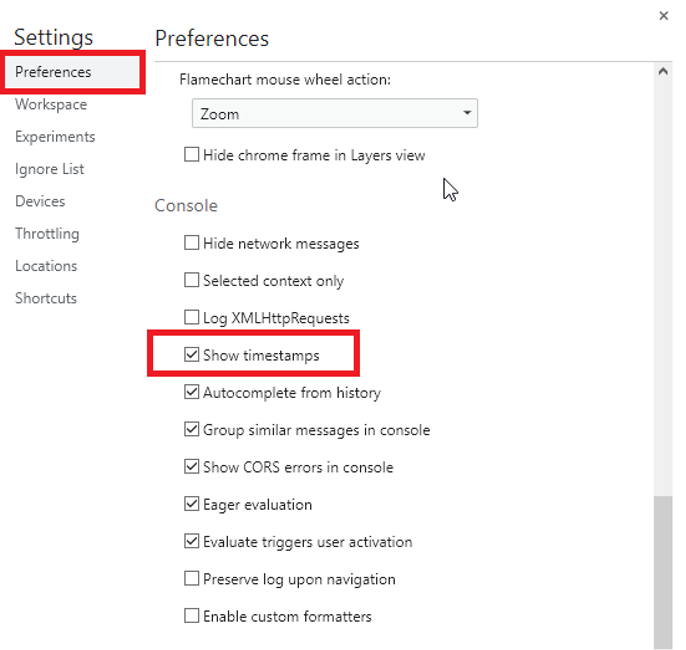
Before gathering Console Logs, we need to turn on Timestamps. Navigate to the Gear icon in the Developer Tools and click Preferences:
-
From Preferences, click Show Timestamps and return to the Developer Tools page:
- Navigate to the Console tab.
- As you did with the Network logs, begin to replicate the problem.
- Once you've experienced the issue, right-click in the Console log section and click Save As from the dropdown menu. Save the file as a .txt file to your desired location on your computer.
Safari
Network and Console Logs
-
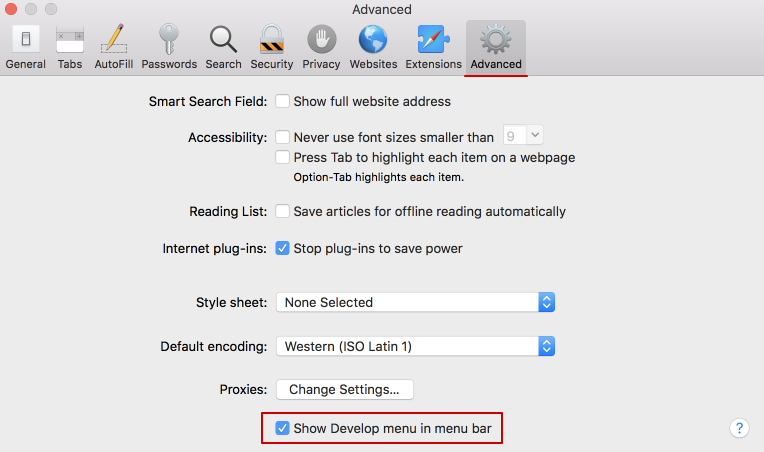
Make sure that the Developer Menu is enabled in Safari. Go to Preferences in Safari (Safari > Preferences) and select the Advanced tab.
-
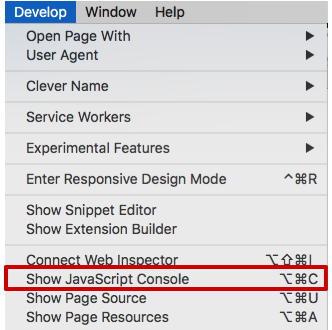
Once this setting is enabled, click on Develop > Show Javascript Console.
-
The console will open either in your current Safari window or a new Safari window. It will automatically select the Console tab to start. You can navigate between the Console and Network tabs, depending on which log you are wanting to pull.

- Attempt to replicate the problem. Perform the action that is causing the issue.
-
Once you've experienced the problem, click the Export icon in the right-hand corner of Safari to save the file to your designated location.

Mozilla Firefox
Network Logs
-
Open a new window of your browser and press the F12 key to open the Developer Tools, then click on the Network tab.
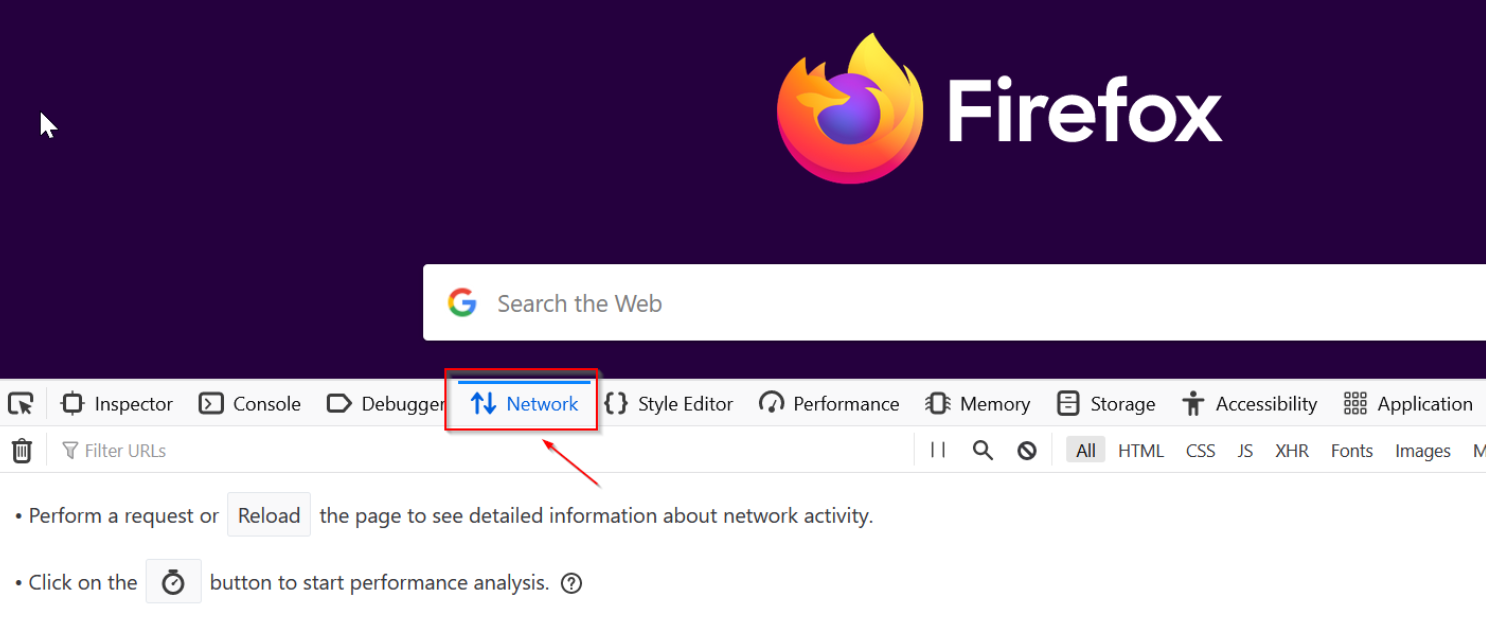
If your keyboard does not have Function keys, you can also navigate to the Settings icon and then Web Developer > Toggle Tools, or press Ctrl + Shift + I if you are using a Windows PC.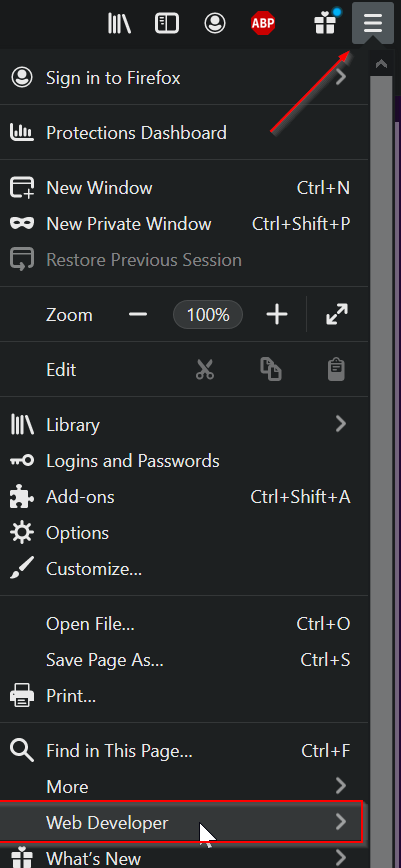
- Attempt to replicate the problem. Perform the task where you are experiencing the issue so that the log may be captured.
-
Once you have experienced the problem, Save the logs as a .HAR file. To do this, right click on any row or blank space and then select Save All as HAR from the dropdown menu.
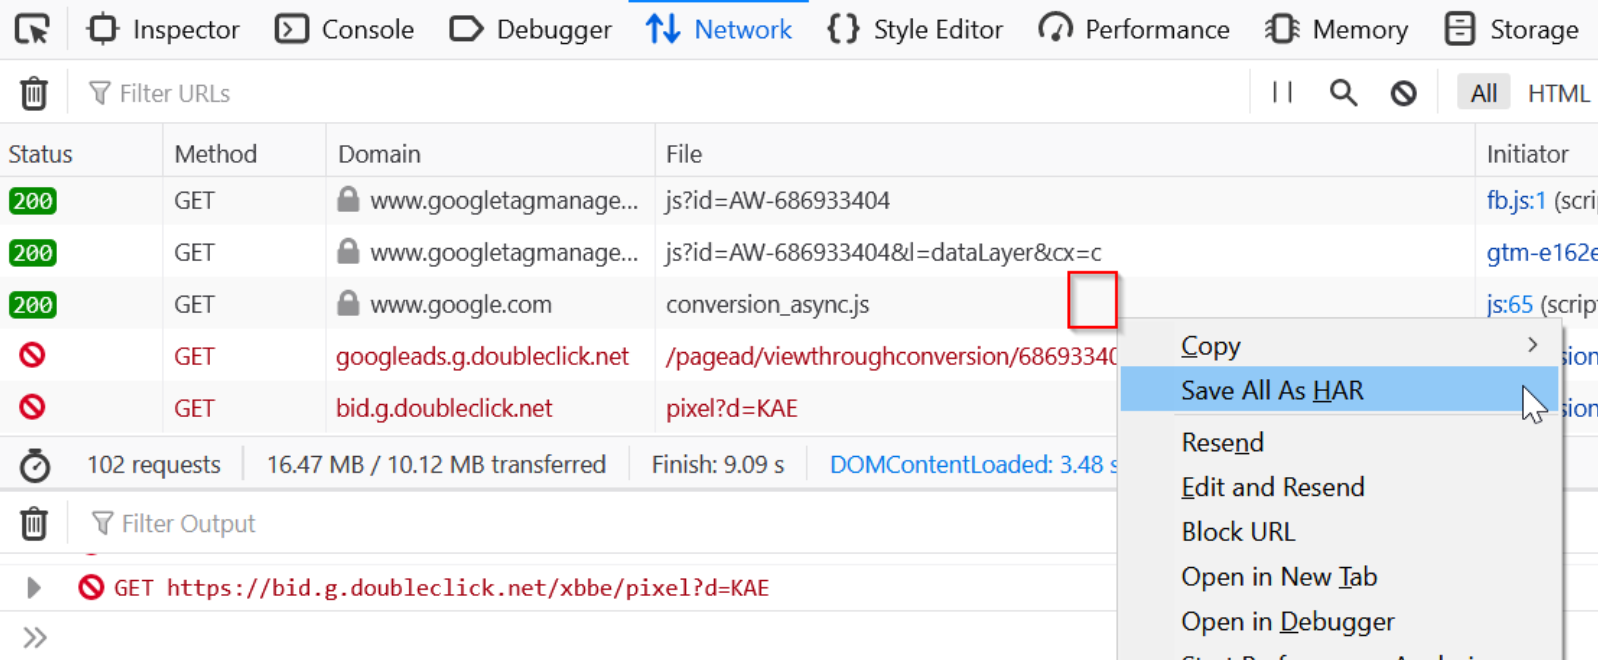
- Save the HAR file in your preferred destination on your computer. This file can be sent to the LiveVox Customer Care team via email as an attachment.
Console Logs
-
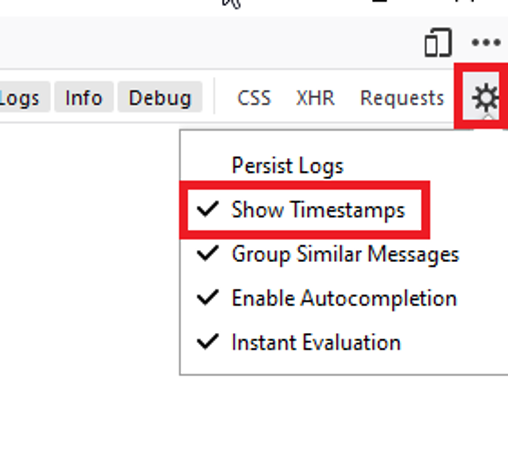
Before gathering Console Logs, we need to turn on Timestamps. Navigate to the Gear icon and click Show Timestamps:
- Navigate to the Console tab in the same toolbar where Network was selected.
-
Attempt to replicate the problem. Once you experience it, right click on the logs and select Export Visible Messages To > File.

- Save the Console log as a .txt file in the preferred folder on your computer. This file can be sent to the LiveVox Customer Care team via email as an attachment.