Emails are one of the most effective and frequently used tools to communicate with customers and include marketing campaigns, payment reminders, or promotions. But how can you measure the success of your email communications?
To help you get an idea of how the emails performed, Livevox provides the Monitor Dashboard for the email channel. The dashboard captures the following statistics for active email campaigns for the current day, in real time:
- State of unattended email campaigns.
- Email queues of agents, including the state of email threads.
For information about how to access the Monitor Dashboard, see Accessing the Monitor Dashboard.
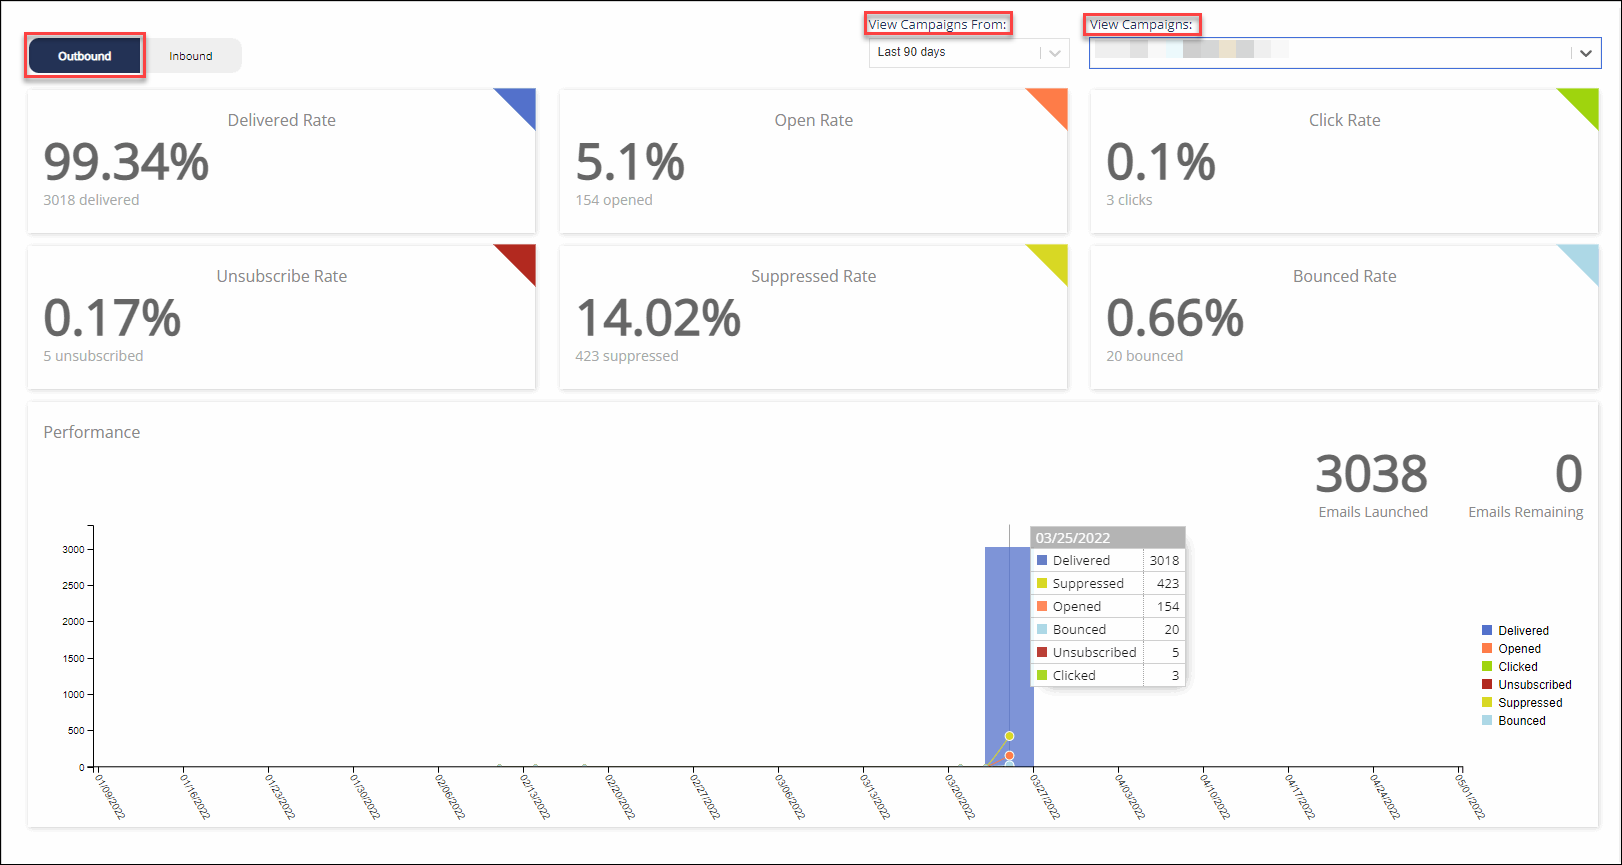
Outbound Email Statistics

| Statistic | Description |
|---|---|
| Bounced Rate | Percentage of emails that are not delivered to the customer. |
| Click Rate | Percentage of emails in which customers clicked a link. |
| Delivered Rate | Percentage of emails that are delivered to customers. |
| Open Rate | Percentage of emails that are opened by customers. |
| Performance | A chart representing the performance of the email channel based on the above statistics, along with the number of launched (delivered) emails and the number of emails remaining. In the chart, the x-axis represents dates and the y-axis represents the number of emails that are delivered, opened, clicked, unsubscribed, suppressed, or bounced. |
| Suppressed Rate | Percentage of emails that are suppressed due to the suppression list. |
| Unsubscribe Rate | Percentage of emails from which customers unsubscribed. |
By default, these statistics appear for email campaigns that are run in the last 30 days. However, you can change the time frame of the campaign using the View Campaigns From field, which contains the following options:
- Today's
- Last 7 days
- Last 30 days
- Last 90 days
In addition, you can select the campaign for which you want to view the outbound statistics using the View Campaigns field, which contains a list of all active campaigns.
Inbound Email Statistics

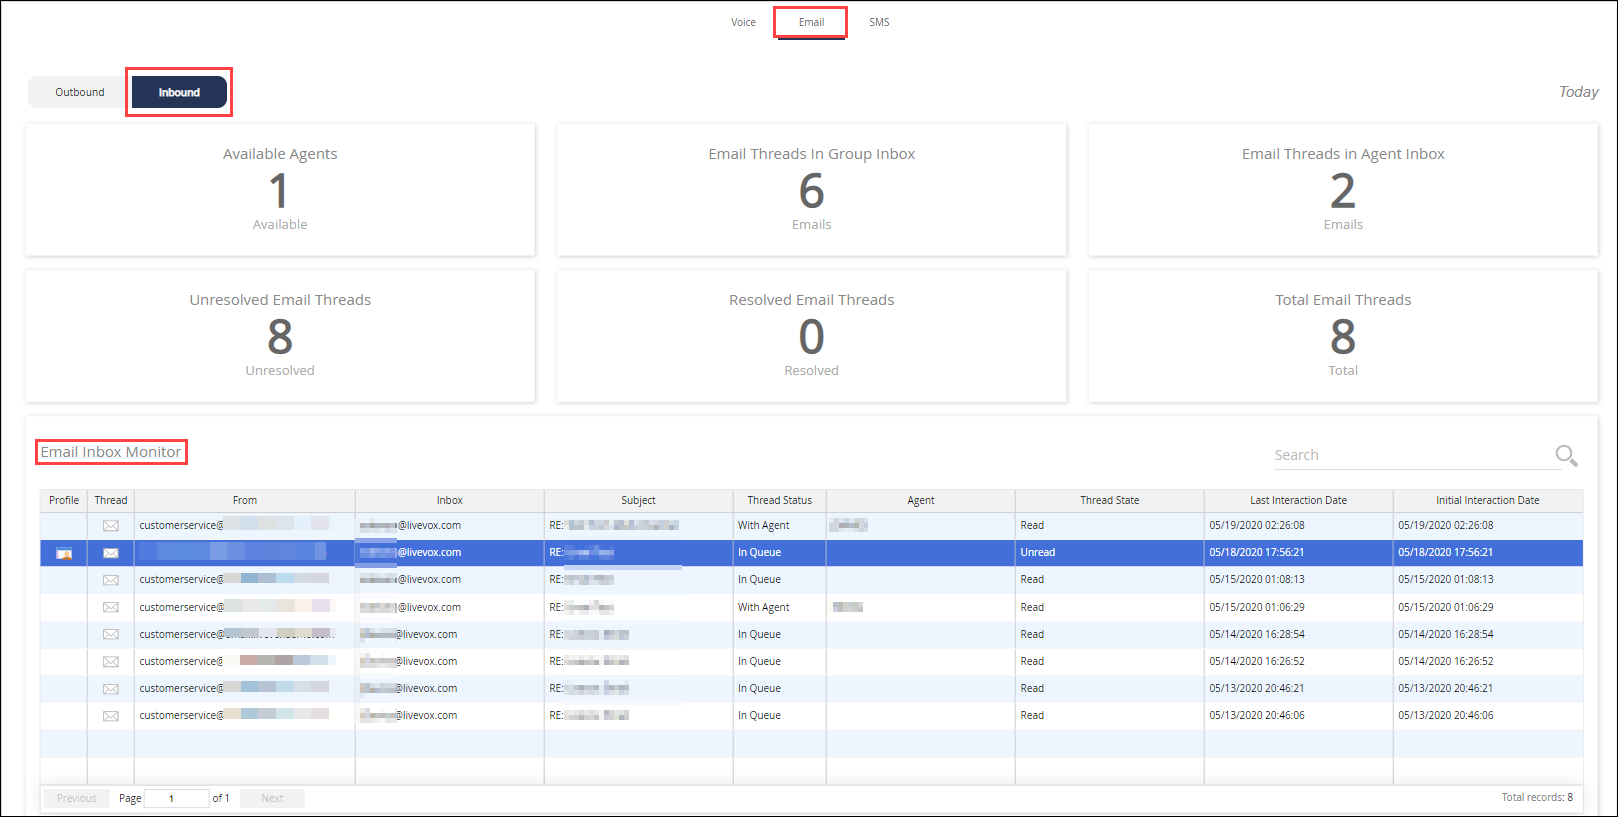
The Inbound tab of the email monitor dashboard displays the following statistics for the current day.
| Statistic | Description |
|---|---|
| Available Agents | Number of agents who are ready to respond to emails. |
| Email Threads in Agent Inbox | Number of email threads in the inboxes of agents who are signed out. |
| Email Threads in Group Inbox | Number of email threads in the group inbox. |
| Resolved Email Threads | Number of resolved email threads. |
| Total Email Threads | Number of all email threads, which includes both unresolved and resolved email threads. |
| Unresolved Email Threads | Number of unresolved email threads, which includes threads in both the agent's inbox and the group inbox. |
In addition, the Inbound tab displays the Email Inbox Monitor table, which provides information about the last 100 active email threads. The table displays the following columns.
| Column | Description |
|---|---|
| Agent | Name of the agent if the value in the Thread Status column is With Agent. |
| From | Email address of the customer. |
| Inbox | Email address to which the customer sent the email. |
| Initial Interaction Date | Time stamp of the first interaction on the thread, represented in Eastern Time. |
| Last Interaction Date | Time stamp of the last interaction on the thread, represented in Eastern Time. |
| Profile | Icon to view the Contact Details window of the customer who is a participant in the thread. |
| Thread | Icon to view the Email Thread window, which contains the entire email conversation that constitutes the thread. |
| Thread State | Current state of the last message on the thread, which is one of the following values:
|
| Thread Status | Current status of the thread, which is one of the following values:
|